
이미 소장하고 있다면 판매해 보세요.
- 국내배송만 가능
- 문화비소득공제 가능
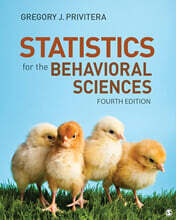
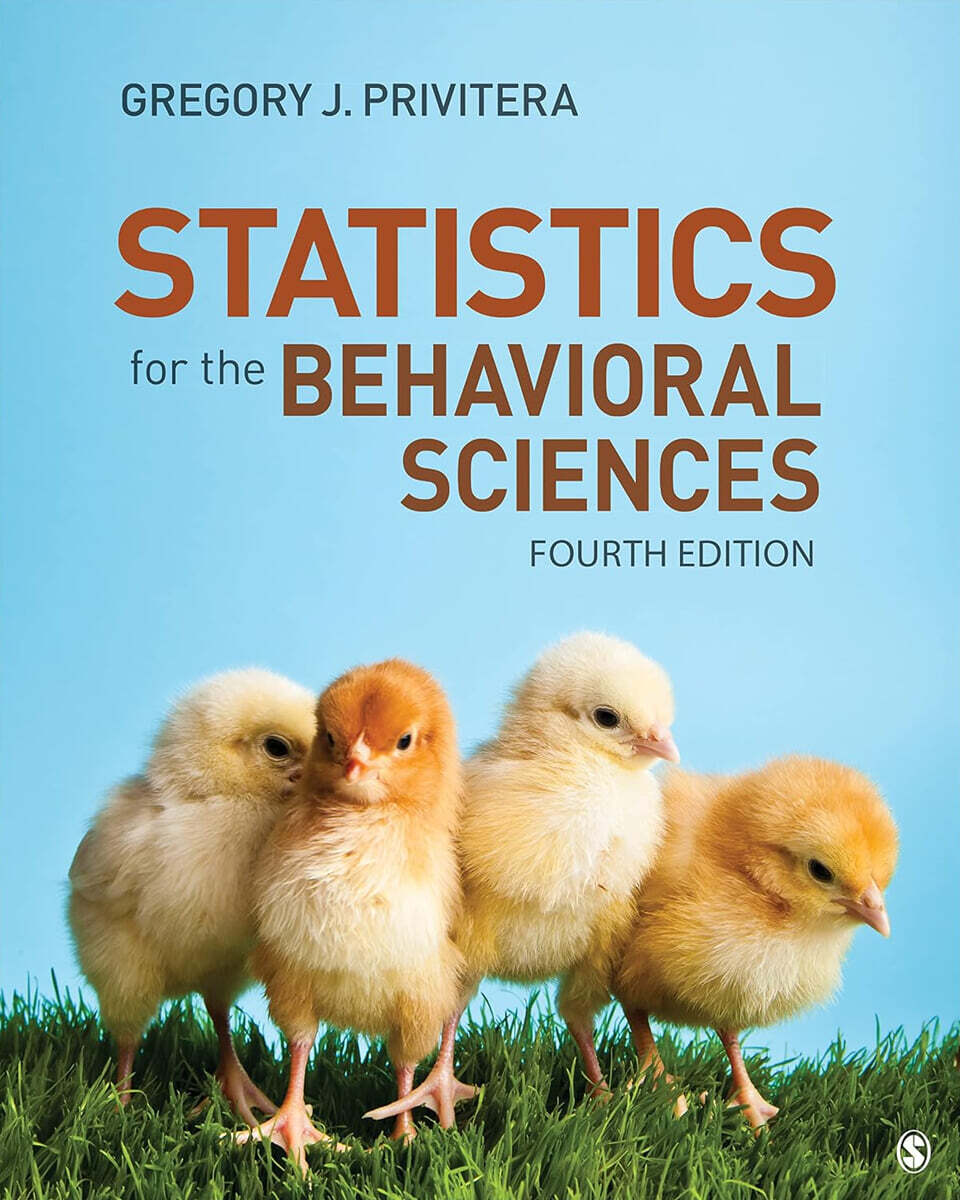
책소개
목차
|
PART I. INTRODUCTION AND DESCRIPTIVE STATISTICS
1. Introduction to Statistics 1.1 The Use of Statistics in Science 1.2 Descriptive and Inferential Statistics 1.3 Research Methods and Statistics 1.4 Scales of Measurement 1.5 Types of Variables for Which Data Are Measured 1.6 SPSS in Focus: Entering and Defining Variables 2. Summarizing Data: Frequency Distributions in Tables and Graphs 2.1 Why Summarize Data? 2.2 Simple Frequency Distributions for Grouped Data 2.3 Other Ways of Summarizing Grouped Data in Frequency Distributions 2.4 Identifying Percentile Points and Percentile Ranks 2.5 SPSS in Focus: Frequency Distributions for Quantitative Data 2.6 Frequency Distributions for Ungrouped Data 2.7 SPSS in Focus: Frequency Distributions for Categorical Data 2.8 Pictorial Frequency Distributions 2.9 Graphing Distributions: Continuous Data 2.10 Stem-and-Leaf Displays 2.11 Graphing Distributions: Discrete and Categorical Data 2.12 SPSS in Focus: Histograms, Bar Charts, Pie Charts, and Stem-and-Leaf Displays 3. Summarizing Data: Central Tendency 3.1 Introduction to Central Tendency 3.2 Measures of Central Tendency: The Mean 3.3 Measures of Central Tendency: The Weighted Mean 3.4 Measures of Central Tendency: The Median and the Mode 3.5 Characteristics of the Mean 3.6 Choosing an Appropriate Measure of Central Tendency 3.7 SPSS in Focus: Mean, Median, and Mode 4. Summarizing Data: Variability 4.1 Introduction to Variability 4.2 The Range 4.3 Quartiles and Interquartiles 4.4 The Variance 4.5 The Computational Formula for Variance 4.6 Explaining Variance for Populations and Samples 4.7 The Standard Deviation 4.8 The Informativeness of Standard Deviation 4.9 SPSS in Focus: Range, Quartiles, Variance, and Standard Deviation PART II. PROBABILITY AND THE FOUNDATIONS OF INFERENTIAL STATISTICS 5. Probability 5.1 Introduction to Probability 5.2 Probability and Relative Frequency 5.3 The Relationship Between Multiple Outcomes 5.4 Conditional Probabilities and Bayes's Theorem 5.5 SPSS in Focus: Probability Tables 5.6 Probability Distributions 5.7 The Mean of a Probability Distribution and Expected Value 5.8 The Variance and Standard Deviation of a Probability Distribution 5.9 Expected Value and the Binomial Distribution 6. Probability, Normal Distributions, and z Scores 6.1 Characteristics of the Normal Distribution 6.2 The Standard Normal Distribution and the z Transformation 6.3 The Unit Normal Table: A Brief Introduction 6.4 Locating Proportions 6.5 Locating Scores 6.6 SPSS in Focus: Converting Raw Scores to Standard z Scores 6.7 The Normal Approximation to the Binomial Distribution 7. Probability and Sampling Distributions 7.1 Selecting Samples From Populations 7.2 Selecting a Sample: Who's In and Who's Out? 7.3 Sampling Distributions: The Mean 7.4 Sampling Distributions: The Variance 7.5 The Standard Error of the Mean 7.6 Factors That Decrease Standard Error 7.7 SPSS in Focus: Estimating the Standard Error of the Mean 7.8 Standard Normal Transformations With Sampling Distributions 8. Hypothesis Testing: Significance, Effect Size, Estimation, and Power 8.1 The Informativeness of Evaluating Effects in Science 8.2 Inferential Statistics and Applying the Steps to Hypothesis Testing 8.3 Making a Decision: Types of Error 8.4 Testing for Significance: Examples Using the z Test 8.5 Measuring the Size of an Effect: Cohen's d 8.6 Confidence Intervals for the One-Sample z Test 8.7 Factors That Influence Power 8.8 Assumptions of Parametric Testing: Normality and Nonparametric Alternatives 8.9 SPSS in Focus: A Preview for Analyzing Inferential Statistics PART III. MAKING INFERENCES ABOUT ONE OR TWO MEANS 9. Testing Means: One-Sample t Test With Confidence Intervals 9.1 Going From z to t 9.2 The Degrees of Freedom 9.3 Reading the t Table 9.4 Computing the One-Sample t Test 9.5 Effect Size for the One-Sample t Test 9.6 Confidence Intervals for the One-Sample t Test 9.7 Inferring Significance and Effect Size From a Confidence Interval 9.8 SPSS in Focus: One-Sample t Test and Confidence Intervals 10. Testing Means: Two-Independent-Sample t Tests With Confidence Intervals 10.1 Introduction to the Between-Subjects Design 10.2 Selecting Two Independent Samples 10.3 Variability and Comparing Differences Between Two Groups 10.4 Computing the Two-Independent-Sample t Test 10.5 Effect Size for the Two-Independent-Sample t Test 10.6 Confidence Intervals for the Two-Independent-Sample t Test 10.7 Inferring Significance and Effect Size From a Confidence Interval 10.8 SPSS in Focus: Two-Independent-Sample t Test and Confidence Intervals 11. Testing Means: The Related-Samples t Test With Confidence Intervals 11.1 Selecting Related Samples 11.2 Advantages of Selecting Related Samples 11.3 Introduction to the Related-Samples t Test 11.4 Computing the Related-Samples t Test 11.5 Measuring Effect Size for the Related-Samples t Test 11.6 Confidence Intervals for the Related-Samples t Test 11.7 Inferring Significance and Effect Size From a Confidence Interval 11.8 SPSS in Focus: Related-Samples t Test and Confidence Intervals PART IV. MAKING INFERENCES ABOUT THE VARIABILITY OF TWO OR MORE MEANS 12. Analysis of Variance: One-Way Between-Subjects Design 12.1 Introduction to Analysis of Variance 12.2 Selecting Two or More Independent Samples 12.3 The Test Statistic and Sources of Variation 12.4 Degrees of Freedom 12.5 The One-Way Between-Subjects ANOVA 12.6 Post Hoc Tests 12.7 Measuring Effect Size 12.8 SPSS in Focus: The One-Way Between-Subjects ANOVA 13. Analysis of Variance: One-Way Within-Subjects (Repeated-Measures) Design 13.1 Analysis of Variance for a Within-Subjects Factor 13.2 The Test Statistic and Sources of Variation 13.3 Degrees of Freedom 13.4 The One-Way Within-Subjects ANOVA 13.5 Post Hoc Comparisons: Bonferroni Procedure 13.6 Measuring Effect Size 13.7 SPSS in Focus: The One-Way Within-Subjects ANOVA 13.8 The Within-Subjects Design: Consistency and Power 14. Analysis of Variance: Two-Way Between-Subjects Factorial Design 14.1 Analysis of Variance With Two Factors 14.2 Designs for the Two-Way ANOVA 14.3 Describing Variability: Main Effects and Interactions 14.4 The Two-Way Between-Subjects ANOVA 14.5 Analyzing Main Effects and Interactions 14.6 Measuring Effect Size 14.7 SPSS in Focus: The Two-Way Between-Subjects ANOVA PART V. MAKING INFERENCES ABOUT PATTERNS, FREQUENCIES, AND ORDINAL DATA 15. Correlation 15.1 The Structure of a Correlational Design 15.2 The Pearson Test Statistic and Sources of Variability 15.3 Assumptions for the Pearson Correlation Coefficient 15.4 Pearson Correlation Coefficient 15.5 Effect Size: The Coefficient of Determination 15.6 SPSS in Focus: Pearson Correlation Coefficient 15.7 Limitations in Interpretation: Causality, Outliers, and Restriction of Range 15.8 Alternative to Pearson's r: Spearman Correlation Coefficient 15.9 SPSS in Focus: Spearman Correlation Coefficient 15.10 Alternative to Pearson's r: Point-Biserial Correlation Coefficient 15.11 SPSS in Focus: Point-Biserial Correlation Coefficient 15.12 Alternative to Pearson's r: Phi Correlation Coefficient 15.13 SPSS in Focus: Phi Correlation Coefficient 16. Linear Regression and Multiple Regression 16.1 The Structure of Linear Regression 16.2 What Makes the Regression Line the Best-Fitting Line? 16.3 The Slope and y-Intercept of a Straight Line 16.4 Using the Method of Least Squares to Find the Best Fit 16.5 Evaluating Significance Using Analysis of Regression 16.6 Using the Standard Error of Estimate to Measure Accuracy 16.7 SPSS in Focus: Analysis of Regression 16.8 Introduction to Multiple Regression 16.9 Evaluating Significance Using Multiple Regression 16.10 The ß Coefficient for Multiple Regression 16.11 Evaluating Significance for the Relative Contribution of Each Predictor Variable 16.12 SPSS in Focus: Multiple Regression Analysis 17. Nonparametric Tests: Chi-Square Tests 17.1 Introduction to the Chi-Square Test 17.2 Comparing Observed and Expected Frequencies for the Goodness-of-Fit Test 17.3 The Test Statistic and Degrees of Freedom for the Goodness-of-Fit Test 17.4 Computing the Chi-Square Goodness-of-Fit Test 17.5 Interpreting the Chi-Square Goodness-of-Fit Test 17.6 SPSS in Focus: The Chi-Square Goodness-of-Fit Test 17.7 Introduction to the Chi-Square Test for Independence 17.8 Computing the Chi-Square Test for Independence 17.9 The Relationship Between Chi-Square and the Phi Coefficient 17.10 Measures of Effect Size 17.11 SPSS in Focus: The Chi-Square Test for Independence 18. Nonparametric Tests: Tests for Ordinal Data 18.1 Tests for Ordinal Data 18.2 The Sign Test 18.3 SPSS in Focus: Computing the Related-Samples Sign Test 18.4 The Wilcoxon Signed-Ranks T Test 18.5 SPSS in Focus: Computing the Wilcoxon Signed-Ranks T Test 18.6 The Mann-Whitney U Test 18.7 SPSS in Focus: Computing the Mann-Whitney U Test 18.8 The Kruskal-Wallis H Test 18.9 SPSS in Focus: Computing the Kruskal-Wallis H Test 18.10 The Friedman Test 18.11 SPSS in Focus: Computing the Friedman Test Appendix B. Basic Math Review and Summation Notation Appendix A. Overview of Core Statistical Concepts in the Behavioral Sciences Appendix C. SPSS General Instructions Guide With Steps for Evaluating Assumptions for Inferential Statistics Appendix D. Statistical Tables Appendix E. Chapter Solutions for Even-Numbered Problems Glossary References Index |
관련 분류
품목정보
- 발행일
- 2023년 01월 17일
- 쪽수, 무게, 크기
- 960쪽 | 1560g | 203*254*40mm
- ISBN13
- 9781544362816
사락 별점0
혜택 및 유의사항밑줄0
혜택 및 유의사항상품정보안내
직수입외서의 경우, 해외거래처에서 제공하는 정보가 부족하여 제목, 표지, 가격, 유통상태 등의 정보가 미비하거나 변경되는 경우가 있습니다. 정확한 확인을 원하시는 경우, 일대일 상담으로 문의하여 주시면 답변 드리겠습니다.
(판형과 판수 등이 다양한 도서는 찾으시는 도서의 ISBN을 알려 주시면 보다 빠르고 정확한 안내가 가능합니다.)
해외거래처에서 품절인 경우, 2차 거래선을 통해 유럽과 미국 출판사로 직접 수입이 진행될 수 있습니다.
수입 진행 시점으로 부터 2~3주가 추가로 소요되며, 해외에서도 유통이 원활하지 않은 도서는 품절 안내가 지연될 수 있습니다.
해당 경우, 문자와 메일로 별도 안내를 드리고 있사오니 마이페이지에서 휴대전화번호와 메일주소를 다시 한번 확인해주시기 바랍니다.
(판형과 판수 등이 다양한 도서는 찾으시는 도서의 ISBN을 알려 주시면 보다 빠르고 정확한 안내가 가능합니다.)
해외거래처에서 품절인 경우, 2차 거래선을 통해 유럽과 미국 출판사로 직접 수입이 진행될 수 있습니다.
수입 진행 시점으로 부터 2~3주가 추가로 소요되며, 해외에서도 유통이 원활하지 않은 도서는 품절 안내가 지연될 수 있습니다.
해당 경우, 문자와 메일로 별도 안내를 드리고 있사오니 마이페이지에서 휴대전화번호와 메일주소를 다시 한번 확인해주시기 바랍니다.
99,000원
총 1개
99,000원