
소득공제
수입
직수입양서
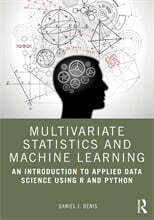
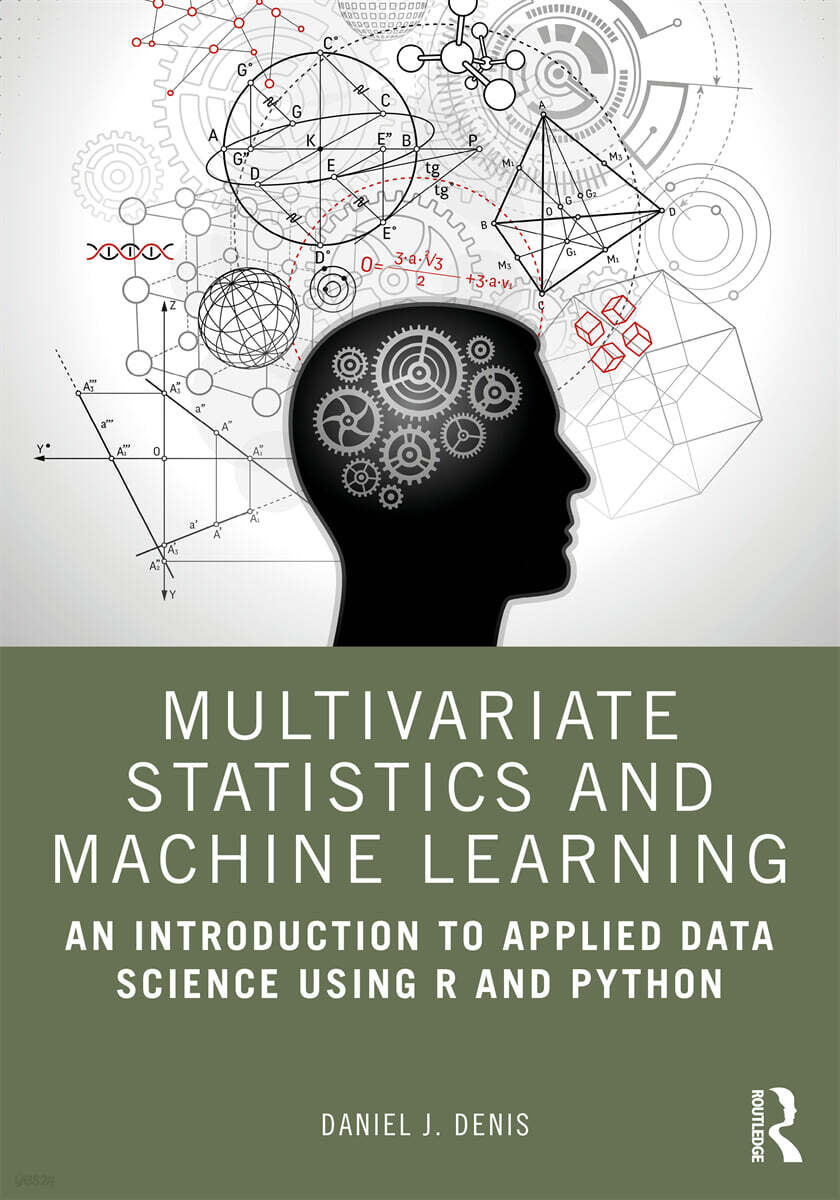
Multivariate Statistics and Machine Learning
An Introduction to Applied Data Science Using R and Python
Paperback, 1st Edition, Illustrations, Color
Daniel J. Deni
Routledge
2025.12.28.
이미 소장하고 있다면 판매해 보세요.
- 국내배송만 가능
- 해외 거래처 사정에 의하여 품절/지연 가능
- 도서 정보 중 미표기 사항 안내?
- 문화비소득공제 가능
책소개
목차
|
Preface PART I ? Preliminaries and Foundations Chapter 0 ? Introduction, Motivation, Pedagogy and Ideas About Learning 0.1. The Paradigm Shift (What Has Changed) 0.1.1. A Wide Divide 0.2. A Unified Vision ? The Bridge 0.3. The Data Science and Machine Learning Invasion (Questions and Answers) 0.4. Who Should Read this Book? 0.4.1. Textbook Limbo 0.4.2. Theoretical vs. Applied vs. Software Books vs. “Cookbooks” 0.4.2.1. Watered Down Statistics 0.4.3. Prerequisites to Reading this Book 0.5. Pedagogical Approach and the Trade-Offs of Top-Down, Bottom-Up Learning 0.5.1. Top-Down, Bottom-Up Learning 0.5.2. Ways of Writing a Book: Making it Pedagogical Instead of Cryptic 0.5.3. Standing on the Shoulders of Giants (A Companion to Advanced Texts) 0.5.4. Making Equations “Speak” 0.5.5. The Power of Problems 0.5.6. Computing Languages 0.5.7. Notation Used in the Book 0.6. Nobody Learns a Million Things (The Importance of Foundations and Learning How to Learn) 0.6.1. Essential Philosophy of Science and History 0.6.2. Beyond the Jargon, Beyond the Hype 0.7. The Power and Dangers of Analogy and Metaphor (Ways of Understanding) 0.7.1. The Infinite Regress of Knowledge ? A Venture into What it Means to “Understand” Something and Why Epistemology is Important 0.7.1.2. Epistemological Maturity 0.8. Format and Organization of Chapters Chapter 1 ? First Principles and Philosophical Foundations 1.1. Science, Statistics, Machine Learning, Artificial Intelligence 1.1.1. Mathematics, Statistics, Computation 1.1.2. Mathematical Systems as a Narrative to Understanding 1.2. The Scope of Data Analysis and Data Science (Expertise in Everything!) 1.2.1. Theoretical vs. Applied Statistics & Specialization 1.3. The Role of Computers 1.3.1. The Nature of Algorithms 1.3.1.2. Algorithmic Stability 1.4. The Importance of Design, Experimental or Otherwise 1.5. Inductive, Deductive, and Other Logics 1.5.1. Consistency and Godel’s Incompleteness Theorems 1.5.1.2. What is the Relevance of Godel? 1.6. Supervised vs. Unsupervised Learning 1.6.1. Fuzzy Distinctions 1.7. Theoretical vs. Empirical Justification 1.7.1. Airplanes and Oceanic Submersibles 1.7.2. Will the Bridge Stay Up if the Mathematics Fail? 1.8. Level of Analysis Problem 1.9. Base Rates, Common Denominators and Degrees 1.9.1. Base Rates and Splenic Masses 1.9.2. Probability Neglect 1.9.3. The “Zero Group” 1.10. Statistical Regularities and Perceptions of Risk 1.10.1. Beck Depression Inventory: How Depressed Are You? 1.11. Decision, Risk Analysis and Optimization 1.11.1. The Risk of Making a Wrong Decision 1.11.2. Statistical Lives and Optimization 1.11.3. Medical Decision-Making and Dominating Criteria 1.12. All Knowledge, Scientific and Other, is Tentative 1.13. Occam’s Razor 1.13.1. Parsimony vs. Complexity Trade-Off 1.14. Overfitting vs. Underfitting 1.14.1. Solutions to Overfitting 1.14.2. The Idea of Regularization 1.15. The Measurement Problem 1.15.1. What is Data? 1.15.2. The Philosophy and Scales of Measurement 1.15.3. Reliability 1.15.3.1. Coefficient Alpha 1.15.3.2. Test-Retest Reliability 1.15.4. Validity 1.15.5. Scales of Measurement 1.15.6. Likert Scales 1.15.6.1. Statistical Models for Likert Data 1.15.6.2. Models for Ordinal and Monotonically Increasing/Decreasing Data Overview of Statistical and Machine Learning Concepts 1.16. Probably Approximately Correct 1.17. No Free Lunch Theorem 1.18. V-C Dimension and Complexity 1.19. Parametric vs. Nonparametric Learning Methods 1.19.1. Flexibility and Number of Parameters 1.19.1.1. Concept of Degrees of Freedom 1.19.2. Instance or Memory-Based Learning 1.19.3. Revisiting Classical Nonparametric Tests 1.20. Dimension Reduction, Distance, and Error Functions: Commonalities in Modeling 1.20.1. Dimension Reduction: What’s the Big Idea? 1.20.2. The Curse of Dimensionality 1.21. Distance 1.22. Error Minimization 1.23. Training vs. Test Error 1.24. Cross-Validation and Model Selection 1.25. Monte Carlo Methods 1.26. Missing Data 1.27. Quantitative Approaches to Data Analysis 1.28. Chapter Review Exercises Chapter 2 ? Mathematical and Statistical Foundations 2.1. Mathematical “Previews” vs. the “Appendix” Approach (Why Previews are Better) 2.1.2. About Proofs 2.2. Elementary Probability and Fundamental Statistics 2.3. Interpretations of Probability 2.4. Mathematical Probability 2.4.1. Unions and Intersections of Events 2.5. Conditional Probability 2.5.1. Unconditional vs. Conditional Statistical Models 2.6. Probabilistic Independence 2.6.1. Everything is About Independence vs. Dependence! 2.7. Marginal vs. Conditional Distributions 2.8. Independence Implies Covariance of Zero, But Covariance of Zero Does Not (Necessarily) Imply Independence 2.9. Sensitivity and Specificity: More Conditional Probabilities 2.10. Bayes’ Theorem and Conditional Probabilities 2.10.1. Bayes’ Factor 2.10.2. Bayesian Model Selection 2.10.3. Bayes’ Theorem as Rational Belief or Theorizing 2.11. Law of Large Numbers 2.11.1. Law of Large Numbers and the Idea of Committee Machines 2.12. Random Variables and Probability Density Functions 2.13. Convergence of Random Variables 2.14. Probability Density Functions 2.15. Normal (Gaussian) Distributions 2.15.1. Univariate Gaussian 2.15.2. Mixtures of Gaussians 2.15.3. Evaluating Univariate Normality 2.15.4. Multivariate Gaussian 2.15.5. Evaluating Multivariate Normality 2.16. Binomial Distributions 2.16.1. Approximation to the Normal Distribution 2.17. Multinomial Distributions 2.18. Poisson Distribution 2.19. Chi-Square Distributions 2.20. Expectation and Expected Value 2.21. Measures of Central Tendency 2.21.1. The Arithmetic Mean (Average) 2.21.1.1. Averaging Over Cases (Why Thinking in Terms of Averages Can Be Dangerous) 2.21.2. The Median 2.22. Measures of Variability 2.22.1. Variance and Standard Deviation 2.22.2. Mean Absolute Deviation 2.23. Skewness and Kurtosis 2.24. Coefficient of Variation 2.25. Statistical Estimation 2.26. Bias-Variance Trade-Off 2.26.1. Is Irreducible Error Really Irreducible? 2.27. Maximum Likelihood Estimation 2.27.1. Why ML is so Popular and Alternatives 2.27.2. Estimation and Confidence Intervals 2.28. The Bootstrap (A Way of Estimating Nonparametrically) 2.28.1. Simple Examples of the Bootstrap 2.28.2. Why not Boostrap Everything? 2.28.3. Variations and Extensions of the Bootstrap 2.29. Elements of Classic Null Hypothesis Significance Testing 2.29.1. One-Tailed vs. Two-Tailed Tests 2.29.2. Effect Size 2.29.3. Cohen’s d (Measure of Effect Size) 2.29.4. Are p-values that Evil? 2.29.5. Absolute vs. Relative Size of Effect (Context Matters) 2.29.6. Comparability of Effect Sizes Across Studies 2.29.7. Operationalizing Predictors 2.30. Central Limit Theorem 2.31. Covariance and Correlation 2.31.1. Why Does rxy Have Limits -1 to +1? 2.31.2. Covariance and Correlation in R and Python 2.31.3. Correlating Linear Combinations 2.31.4. Covariance and Correlation Matrices 2.32. Z-Scores and Z-Tests 2.32.1. Z-tests and T-tests for the Mean 2.33. Unequal Variances: Welch-Satterthwaite Approximation 2.34. Paired Data 2.35. Review Exercises 2.36 Linear Algebra and Matrices 2.36.1. Vectors 2.36.1.2. Vector Spaces and Fields 2.36.1.3. Zero, Unit Vectors, and One-Hot Vectors 2.36.1.4. Transpose of a Vector 2.36.1.5. Vector Addition and Length 2.36.1.6. Eigen Analysis and Decomposition 2.36.1.7. Points vs. Vectors 2.37. Matrices 2.37.1. Identity Matrix 2.37.2. Transpose of a Matrix 2.37.3. Symmetric Matrices 2.37.4. Matrix Addition and Multiplication 2.37.5. Meaning of Matrices (Matrices as Data and Transformations) 2.37.6. Kernel (Null Space) 2.37.7. Trace of a Matrix 2.38. Linear Combinations 2.39. Determinants 2.40. Means and Variances of Matrices 2.41. Determinant as a Generalized Variance 2.42. Matrix Inverse 2.42.1. Nonexistence of an Inverse and Singularity 2.43. Quadratic Forms 2.44. Positive Definite Matrices 2.45. Inner Products 2.46. Linear Independence 2.47. Rank of a Matrix 2.48. Orthogonal Matrices 2.49. Kernels, the Kernel Trick, and Dual Representations 2.49.1. When are Kernel Methods Useful? 2.50. Systems of Equations 2.51. Distance 2.52. Projections and Basis 2.53. The Meaning of Linearity 2.54. Basis and Dimension 2.54.1. Orthogonal Basis 2.55. Review Exercises 2.56. Calculus and Optimization 2.57. Functions, Approximation and Continuity 2.57.1. Definition of Continuity 2.58. The Derivative 2.58.1. Local Behavior and Approximation 2.58.2. Composite Functions and Basis Expansions 2.59. The Partial Derivative 2.60. Optimization and Gradients 2.60.1. What Does “Optimal” Mean? 2.60.2. Minima and Maxima via Calculus 2.60.3. Convex vs. Non-Convex Functions and Sets 2.61. Gradient Descent 2.61.1. How Does Gradient Descent Find Minima? 2.62. Integral Calculus 2.62.1. Double and Triple Integrals 2.63. Review Exercises Chapter 3 ? R and Python Software 3.1. The Dominance of R and Python 3.2. The R-Project 3.2.1. Installing R 3.2.2. Working with Data 3.2.2.1. Building a Data Frame 3.2.3. Installing Packages in R 3.2.4. Writing Functions in R 3.2.5. Mathematics and Statistics Using R 3.2.5.1. Addition, Subtraction, Multiplication and Division 3.2.5.2. Logarithms and Exponentials 3.2.5.3. Vectors and Matrices 3.2.5.4. Means 3.2.5.5. Covariance and Correlation 3.2.5.6. Sampling with Replacement in R 3.2.5.7. Visualization and Plots 3.2.5.7.1. Boxplots 3.2.6. Further Readings and Resources in R 3.3. Python 3.3.1. Installing Python 3.3.2. Elements of Python 3.3.3. Working With Data 3.3.4. Python Functions for Data Analysis 3.3.4.1. Mathematics Using Python 3.3.4.2. Splitting Data into Train and Test Sets 3.3.4.3. Preprocessing Data 3.3.5. Further Readings and Resources in Python 3.4. Chapter Review Exercises PART II ? Models and Methods Chapter 4 ? Univariate and Multivariate Analysis of Variance Models 4.1. The Classic ANOVA Model 4.1.1. Mean Squares 4.1.2. Expected Mean Squares of ANOVA 4.1.3. Effect Sizes for ANOVA 4.1.4. Contrasts and Post-Hoc Tests for ANOVA 4.1.5. ANOVA in Python 4.1.6. ANOVA in R 4.2. Factorial ANOVA and Higher-Order Models 4.2.1. Factorial ANOVA in Python 4.3. Random Effects and Mixed Models 4.3.1. The Meaning of a Fixed vs. Random Effect 4.3.2. Is the Fixed-Effects Model Actually Fixed? A Look at the Error Term 4.3.3. Mixed Models in Python 4.3.4. Mixed Models in R 4.4. MultiLevel Modeling 4.4.1. A Garbled Mess of Jargon 4.4.2. Why Do Multilevel Models Often Include Random Effects? 4.4.3. A Priori vs. Post-Hoc “Nesting” 4.4.4. Blocking as an Example of Hierarchical/Multilevel Structure 4.4.5. Non-Parametric Random-Effects Model 4.5. Repeated Measures and Longitudinal Models 4.5.1. Classic Repeated Measures Models 4.6. Multivariate Analysis of Variance (MANOVA) 4.6.1. Suitability of MANOVA 4.6.2. Extending the Univariate Model (Hotelling’s T2) 4.6.3. Multivariate Test Statistics 4.6.4. Evaluating Equality of Covariance Matrices (The Box-M Test) 4.6.5. MANOVA in Python 4.6.6. MANOVA in R 4.7. Linear Discriminant Analysis (as the “Reverse” of MANOVA) 4.8. Chapter Review Exercises Chapter 5 ? Simple Linear and Multiple Regression Models (and Extensions) 5.1. Simple Linear Regression ? Fixed Predictor Case 5.1.1. Parameter Estimates 5.1.2. Simple Linear Regression in R 5.1.3. Simple Linear Regression in Python 5.2. Multiple Linear Regression 5.2.1. Minimizing Squared vs. Absolute Deviations 5.2.2. Hypothesis-Testing in Multiple Regression 5.2.3. Multiple Linear Regression in Python 5.2.4. Multiple Linear Regression in R 5.3. Geometry of Least-Squares 5.4. Gauss-Markov Theorem (What We Like About Least-Squares Estimates) 5.4.1. Are Unbiased Estimators Always Best? 5.5. Time Series (An Example of Correlated Errors) 5.6. Model Selection in Regression (Is There an Optimal Model?) 5.7. Effect Size and Adjusting the Training Error Rate 5.7.1. R2, Adjusted R2, Cp, AIC, BIC 5.7.2. Comparing , , AIC, BIC to Cross-Validation 5.8. Assumptions for Regression 5.8.1. Collinearity 5.8.1.1. Variance Inflation Factor 5.8.2. Collinearity Necessarily Implies Redundancy Only in Terms of Variance 5.9. Variable Selection Methods (Building the Regression Model) 5.9.1. Forward, Backward and Stepwise in R 5.10. Mediated and Moderated Regression Models 5.10.1. Statistical Mediation 5.10.2. Statistical Moderation 5.10.3. Moderated Mediation 5.10.4. Mediation in Python 5.11. Further Directions and a Final Word of Warning on Mediation and Moderation 5.12. Principal Components Regression 5.12.1. What is Principal Components Analysis? 5.12.2. PCA Regression and Singularity 5.12.3. Principal Components Regression in R 5.13. Partial Least-Squares Regression 5.13.1. Partial Least Squares in R 5.13.2. Partial Least Squares in Python 5.14. Multivariate Reduced-Rank Regression 5.15. Canonical Correlation 5.15.1. Canonical Correlation in R 5.16. Chapter Review Exercises Chapter 6 ? Regularization Methods in Regression: Ridge, Lasso, Elastic Net 6.1. The Concept of Regularization 6.1.1. Regularization in Regression and Beyond 6.2. Ridge Regression 6.2.1. Mathematics of Ridge Regression 6.2.2. Consequence of Ridge Estimator 6.2.3. Revisiting the Bias-Variance Tradeoff (Why Ridge is Useful) 6.2.4. A Visual Look at Ridge Regression 6.2.5. Ridge Regression in Python 6.2.6. Ridge Regression in R 6.3. Lasso Regression 6.3.1. Lasso Regression in Python 6.3.2. Lasso Regression in R 6.4. Elastic Net 6.4.1. Elastic Net in Python 6.5. Which Regularization Penalty is Better? 6.6. Least-Angle Regression 6.6.1. Least-Angle Regression in R 6.7. Additional Variable Selection Algorithms 6.8. Chapter Review Exercises Chapter 7 ? Nonlinear and Nonparametric Regression 7.1. Polynomial Regression 7.1.1. Polynomial Regression in Python 7.1.2. Polynomial Regression in R 7.1.3. Polynomial Regression as a Global Strategy 7.1.4. A More Local Alternative 7.1.5. Least-Squares Regression Line as a “Floating Mean” (Toward a Localized Approach) 7.1.5.1. Zooming in on Locality 7.2. Basis Functions and Expansions 7.2.1. Basis Functions and Locality 7.2.2. Neural Networks as a Basis Expansion (Generalizing the Concept) 7.2.3. Regression Splines and the Concept of a “Knot” 7.2.4. Conceptualizing Regression Splines 7.2.5. Problem with Splines and Imposing Constraints 7.2.6. Polynomial Regression vs. Regression Splines 7.3. Nonparametric Regression: Local and Kernel Regression 7.3.1. Motivating Kernel Regression via Local-Averaging 7.3.2. Kernel Regression ? “Locally Weighted Averaging” 7.3.3. A Variety of Kernels 7.3.4. Kernel Regression is not Nonlinear; It is Nonparametric 7.3.5. Kernel Regression in R 7.4. Chapter Review Exercises Chapter 8 ? Generalized Linear and Additive Models: Logistic, Poisson, and Related Models 8.1. How to Operationalize the Response 8.1.1. Pros and Cons of Binning 8.1.2. Detecting New Classes or Categories 8.2. The Generalized Linear Model 8.2.1. Intrinsically Linear Models 8.2.2. General vs. Generalized Linear Models 8.3. The Logistic Regression Model 8.3.1. Odds and Odds Ratios 8.3.2. Logistic Regression in R 8.3.3. Logistic Regression in Python 8.4. Generalized Linear Models and Neural Networks 8.5. Multiple Logistic Regression 8.5.1. Multiple Logistic Regression in R 8.6. Poisson Regression 8.6.1. Poisson Regression in R 8.6.2. Poisson Regression in Python 8.7. Generalized Additive Models (A Flexible Nonparametric Alternative) 8.7.1. Why Use a Smoother Instead of Linear Weights? 8.7.2. Deriving the Generalized Additive Model 8.7.3. GAM as a Smooth Extension to GLLM 8.7.4. Generalized Additive Models and Neural Networks 8.7.5. Linking the Logit to the Additive Logistic Model 8.8. Overview and Recap of Nonlinear Approaches for Nonlinear Regression 8.9. Discriminant Analysis 8.9.1. Bayes is Best for Classification 8.9.2. Why Not Always Bayes? 8.9.3. The Linear Discriminant Analysis Model 8.9.4. How LDA Approximates Bayes 8.9.5. Estimating the Prior Probability 8.10. Multiclass Discriminant Analysis 8.11. Discriminant Analysis in a Simple Scatterplot 8.12. Quadratic Discriminant Analysis 8.13. Regularized Discriminant Analysis 8.14. Discriminant Analysis in R 8.15. Discriminant Analysis in Python 8.16. Naive Bayes (Approximating the Bayes Classifier by Assuming (Conditional) Independence) 8.16.1. What Makes Naive Bayes “Naive”? 8.16.2. Naive Bayes in Python 8.17. LDA, QDA, Naive Bayes: Which is Best? 8.18. Nonparametric K-Nearest Neighbors 8.18.1. K-Nearest Neighbor (KNN): Only Looking at Nearby Points 8.18.2. Example of KNN 8.18.3. Disadvantages of KNN 8.19. Chapter Review Exercises Chapter 9 ? Support Vector Machines 9.1. Maximum Margin Classifier 9.1.1. When Sum Does Not Equal Zero 9.1.1.1. So, What’s the Problem? 9.1.2. Building the Maximal Margin Classifier 9.2. The Case of No Separating Hyperplane 9.3. Support Vector Classifier for the Non-Separable Case 9.4. Support Vector Machines (Introducing the Kernel for Nonlinearity) 9.4.1. Enlarging the Feature Space with Kernels 9.4.2. Support Vector Machines in Python 9.4.3. Support Vector Machines in R 9.5. Chapter Review Exercises Chapter 10 ? Decision Trees, Bagging, Random Forests and Committee Machines 10.1. Why Combining Weak Learners Works (Concept of Variance Reduction Using Averages) 10.2. Decision Trees 10.2.1. How Should Trees Be Grown? 10.2.2. Optimization Criteria for Tree-Building 10.2.3. Why not Multiway Splits? 10.2.4. Overfitting, Saturation, and Tree Pruning 10.2.5. Cost-Complexity or Weakest-Link Pruning 10.3. Classification Trees 10.3.1. Gini Index 10.3.2. Decision Trees in R 10.4. Committee Machines 10.5. Overview of Bagging and Boosting 10.5.1. Bagging 10.5.2. A Familiar Example (Bagging Samples and the Variance of the Mean) 10.5.3. A Deeper Look at Bagging 10.5.4. Out-of-Bag Error 10.5.5. Interpreting Results from Bagging 10.5.6. Bagging in R 10.6. Random Forests 10.6.1. The Problem with Bagging Decision Trees 10.6.2. Equivalency of Random Forests and Bagging 10.6.3. Random Forests in R 10.7. Boosting 10.7.1. Boosting Using R 10.8. Stacked Generalization 10.9. Chapter Review Exercises Chapter 11 ? Principal Components Analysis, Blind Source Separation, and Manifold Learning 11.1. Dimension Reduction and Jargon 11.2. Deriving Classic Principal Components Analysis 11.2.1. The 2nd Principal Component 11.2.2. PCA as a Least-Squares Technique and Minimizing Reconstruction Error 11.2.3. Choosing the Number of Derived Components 11.2.4. Why Reconstruction Error is Insufficient for Choosing Number of Components 11.2.5. Constraints on Components 11.2.6. Centering Observed Variables 11.2.7. Orthogonality of Components 11.2.8. Proportion of Variance Explained by Each Component (Covariance vs. Correlation Matrices) 11.2.9. Principal Components as a Rotation of Axes 11.2.10 Principal Components, Discriminant Functions, Canonical Variates (Linking Foundations) 11.2.11. Principal Components in Python 11.2.12. Principal Components in R 11.2.13. Cautionary Concerns and Caveats Regarding Principal Components 11.3. Independent Components Analysis 11.3.1. Principal Components vs. Independent Components Analysis 11.4. Probabilistic PCA 11.4.1. Motivation for Probabilistic PCA 11.4.2. Probabilistic PCA in R 11.5. PCA for Discrete, Binary, and Categorical Data 11.6. Nonlinear Dimension Reduction 11.6.1. Kernel PCA 11.6.2. How KPCA Works 11.6.3. Kernalizing and Computational Complexity 11.6.4. Reconstruction Error in Kernel PCA 11.6.5. The Matrices of Kernel PCA 11.6.6. Classical PCA as a Special Case of Kernel PCA 11.6.7. “Kernel Trick” is Not Simply About Cost 11.6.8. Kernel PCA in Python 11.6.9. Kernel PCA in R 11.7. Principal Curves 11.7.1. Principal Components as a Special Case of Principal Curves and Surfaces 11.7.2. Principal Curves in R 11.8. Principal Components Analysis as an Encoder 11.9. Neural Networks and PCA as Autoencoders 11.10. Multidimensional Scaling 11.10.1. Merits of MDS 11.10.2. Metric vs. Non-Metric (Ordinal) Scaling 11.10.3. Weakness of MDS: “Closeness” Can be Arbitrary 11.10.4. Standardization of Distances 11.10.5. MDS in Python 11.10.6. MDS in R 11.11. Self-Organizing Maps 11.12. Manifold Learning 11.12.1. Manifold Hypothesis 11.12.2. Example of a Simple Manifold 11.12.3. Nonparametric Manifolds 11.12.4. Geodesic Distances 11.13. Local Linear Embedding 11.13.1. LLE in Python 11.14. Isomap 11.14.1. Isomap in Python 11.15. Stochastic Neighborhood Embedding (SNE) 11.15.1. SNE in R 11.16. t-SNE 11.16.1. Performance of t-SNE to Other Techniques 11.16.2. t-SNE in Python 11.16.3. t-SNE in R 11.17. Manifold Learning and Beyond 11.18. Chapter Review Exercises Chapter 12 ? Exploratory Factor Analysis 12.1. Why Treat Factor Analysis in its Own Chapter? 12.2. Common Orthogonal Factor Model 12.2.1. Factor Analysis is a Regression Model 12.2.2. Assumptions Underlying the Factor Analysis Model 12.2.3. Implied Covariance Matrix 12.3. The Problem with Factor Analysis 12.3.1. The Problem is the Users, Not the Method 12.3.2. Factor Analysis Generalizes to Machine Learning 12.4. Factor Estimation 12.4.1. Principal Factor (Principal Axis Factoring) 12.4.2. Maximum Likelihood 12.5. Factor Rotation 12.5.1. Varimax 12.5.2. Quartimax 12.6. Bartlett’s Test of Sphericity 12.6.1. Factor Analysis in Python 12.6.2. Factor Analysis in R 12.7. Independent Factor Analysis 12.8. Nonlinear Factor Analysis (and Autoencoders) 12.8.1. Unpacking the Autoencoder 12.8.2. Factor Analysis as a Neural Network 12.9. Probabilistic “Sensible” PCA (again) 12.10. Mixtures of Factor Analysis (Modeling Local Linearity) 12.11. Item Factor Analysis 12.12. Sparse Factor Analysis 12.13. Chapter Review Exercises Chapter 13 ? Confirmatory Factor Analysis, Path Analysis and Structural Equation Modeling 13.1. What Makes a Model “Exploratory” vs. “Confirmatory”? 13.2. Why “Causal Modeling” is not Causal at all 13.2.1. Misguided History 13.2.2. Baron and Kenny (1986) 13.3. Is the Variable Measurable? The Observed vs. Unobserved Distinction 13.4. Path Analysis (Extending Regression and Previewing SEM) 13.4.1. Exogenous vs. Endogenous Variables 13.5. Confirmatory Factor Analysis Model 13.6. Structural Equation Models 13.6.1. Covariance Modeling 13.6.2. Evaluating Model Fit 13.6.3. Overall (Absolute) Measures 13.6.4. Incremental Fit Indices 13.7. Structural Equation Modeling with Nonlinear Effects 13.7.1. Example of a Nonlinear SEM 13.7.2. Structural Equation Nonparametric and Semiparametric Mixture Models 13.8. Caveats Regarding SEM Models 13.9. SEM in R 13.10. Chapter Review Exercises Chapter 14 ? Cluster Analysis and Data Segmentation 14.1. Cluster Paradigms and Classifications 14.2. Are Clusters Meaningful? 14.3. Dissimilarity Metrics (The Basis of Clustering Algorithms) 14.4. Association Rules (Market Basket Analysis) 14.5. Why Not Consider All Groups? 14.5.1. What Makes a “Good” Clustering Algorithm? 14.6. Distance and Proximity Metrics 14.7. Is the Data Clusterable? 14.8. Algorithms for Cluster Analysis 14.8.1. K-Means Clustering and K-Representatives 14.8.2. How K-Means Works 14.8.3. Defining Proximity for K-Means 14.8.4. Setting k in K-Means 14.8.5. Weakness of K-Means 14.8.6. K-means vs. ANOVA vs. Discriminant Analysis 14.8.7. Making K-Means Probabilistic via K-Means ++ 14.8.8. Using the Data: K-Medoids Clustering 14.8.9. K-Means in Python 14.8.10. K-Means in R 14.9. Sparse and Longitudinal K-Means 14.10. Hierarchical Clustering 14.10.1. Agglomerative Clustering in Python 14.10.2. Agglomerative Clustering in R 14.11. Density-Based Clustering (DBSCAN) 14.11.1. Dense Points and Crowded Regions 14.11.2. DBSCAN in R 14.12. Clustering via Mixture Models 14.12.1. Model Selection for Clustering Solutions 14.13. Cluster Validation 14.14. Cluster Analysis and Beyond 14.15. Chapter Review Exercises Chapter 15 ? Artificial Neural Networks and Deep Learning 15.1. The Rise of Neural Networks: Original Motivation 15.2. Rosenblatt’s Perceptron 15.3. Big Picture Overview of Machine Learning and Neural Networks 15.3.1. What is a Neural Network? (Minimizing the Hype) 15.3.2. Neural Networks are Composite Functions 15.4. Single Layer Feedforward Neural Network 15.5. What is an Activation Function? 15.5.1. Activation Functions do not “Activate” Anything 15.5.2. Types of Activation Functions 15.5.3. Saturating vs. Non-Saturating Activation Functions 15.5.3.1. The Problem with ReLU 15.5.3.2. LeakyReLU 15.5.4. Which Activation Function to Use? 15.6. The Multilayer Perceptron ? A Deeper Look at Neural Networks 15.7. Training Neural Networks 15.7.1. Backpropagation and Minimizing Error Sums of Squares 15.8. How Many Hidden Nodes and Layers to Include? 15.9. Overfitting in Neural Networks 15.9.1. Early Stopping 15.9.2. Dropout Method 15.9.3. Regularized Network 15.10. Types of Networks 15.11. The Universal Approximation Theorem (The Appeal of Neural Networks) 15.11.1.Visualizing the Universal Approximation Theorem 15.12. Neural Networks and Projection Pursuit 15.12.1. Projection Pursuit Regression and Relation to Neural Networks 15.13. Summary, Warnings and Caveats of Neural Networks 15.14. Neural Networks in Python 15.15. Neural Networks in R 15.16. Chapter Review Exercises Concluding Remarks References Index |
관련 분류
품목정보
- 발행일
- 2025년 12월 28일
- 쪽수, 무게, 크기
- 584쪽 | 1120g | 180*250mm
- ISBN13
- 9781032454283
리뷰/한줄평0
상품정보안내
직수입외서의 경우, 해외거래처에서 제공하는 정보가 부족하여 제목, 표지, 가격, 유통상태 등의 정보가 미비하거나 변경되는 경우가 있습니다. 정확한 확인을 원하시는 경우, 일대일 상담으로 문의하여 주시면 답변 드리겠습니다.
(판형과 판수 등이 다양한 도서는 찾으시는 도서의 ISBN을 알려 주시면 보다 빠르고 정확한 안내가 가능합니다.)
해외거래처에서 품절인 경우, 2차 거래선을 통해 유럽과 미국 출판사로 직접 수입이 진행될 수 있습니다.
수입 진행 시점으로 부터 2~3주가 추가로 소요되며, 해외에서도 유통이 원활하지 않은 도서는 품절 안내가 지연될 수 있습니다.
해당 경우, 문자와 메일로 별도 안내를 드리고 있사오니 마이페이지에서 휴대전화번호와 메일주소를 다시 한번 확인해주시기 바랍니다.
(판형과 판수 등이 다양한 도서는 찾으시는 도서의 ISBN을 알려 주시면 보다 빠르고 정확한 안내가 가능합니다.)
해외거래처에서 품절인 경우, 2차 거래선을 통해 유럽과 미국 출판사로 직접 수입이 진행될 수 있습니다.
수입 진행 시점으로 부터 2~3주가 추가로 소요되며, 해외에서도 유통이 원활하지 않은 도서는 품절 안내가 지연될 수 있습니다.
해당 경우, 문자와 메일로 별도 안내를 드리고 있사오니 마이페이지에서 휴대전화번호와 메일주소를 다시 한번 확인해주시기 바랍니다.
124,840원
총 1개
124,840원