
이미 소장하고 있다면 판매해 보세요.
- 국내배송만 가능
- 문화비소득공제 가능
책소개
목차
|
Ch. 1 Profiling 1
Ch. 2 Code coverage 37 Ch. 3 GNU debugger (gdb) 53 Ch. 4 Memory management debugging 81 Ch. 5 System information (/proc) 111 Ch. 6 System tools 151 Ch. 7 System error messages 187 Ch. 8 Event logging 211 Ch. 9 Linux trace toolkit 233 Ch. 10 Oprofile : profiler supported by the kernel 261 Ch. 11 User-model Linux 291 Ch. 12 Dynamic probes 315 Ch. 13 Kernel-level debuggers (kgdb and kdb) 333 Ch. 14 Crash dump 371 |
품목정보
- 발행일
- 2005년 10월 07일
- 쪽수, 무게, 크기
- 512쪽 | 크기확인중
- ISBN13
- 9780131492479
관련 자료
|
Jacket Description/Back:
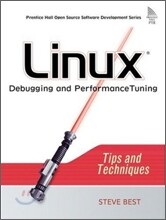
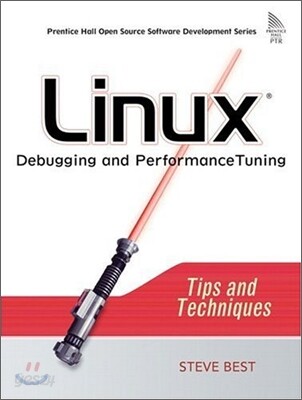
Learn Linux debugging and optimization--at kernel and application levels--hands-on! This is the definitive guide to Linux software debugging and performance optimization at both the kernel and application levels. Using extensive Linux code examples, Steve Best systematically introduces open source tools and best-practice techniques for delivering bug-free, well-tuned code. Drawing on his exceptional experience optimizing Linux systems for IBM, Best covers issues ranging from memory management and I/O to system processes and kernel bug messages. You' ll walk through real debugging sessions, discovering the strategies experts use to debug even the most complex application- and kernel-related problems. You' ll master sophisticated profiling techniques for identifying and resolving bottlenecks more quickly and learn how to capture the right data in the event of trouble. Coverage includes Bottleneck identification Code coverage Debuggers: gdb, kgdb, and KDB Memory management /proc kernel data analysis System process monitoring Network performance Oops bug messages Syslog and event logging Execution traces Profiling kernel behavior Cache misses User-Mode Linux Dynamic probes Crash dump analysis And more... "Linux(R) Debugging and Performance Tuning will be indispensable for every developer who needs to supercharge the Linux kernel and applications, and for every administrator and support specialist who must resolve Linux reliability or performance issues. (c) Copyright Pearson Education. All rights reserved. |
리뷰/한줄평0
상품정보안내
직수입외서의 경우, 해외거래처에서 제공하는 정보가 부족하여 제목, 표지, 가격, 유통상태 등의 정보가 미비하거나 변경되는 경우가 있습니다. 정확한 확인을 원하시는 경우, 일대일 상담으로 문의하여 주시면 답변 드리겠습니다.
(판형과 판수 등이 다양한 도서는 찾으시는 도서의 ISBN을 알려 주시면 보다 빠르고 정확한 안내가 가능합니다.)
해외거래처에서 품절인 경우, 2차 거래선을 통해 유럽과 미국 출판사로 직접 수입이 진행될 수 있습니다.
수입 진행 시점으로 부터 2~3주가 추가로 소요되며, 해외에서도 유통이 원활하지 않은 도서는 품절 안내가 지연될 수 있습니다.
해당 경우, 문자와 메일로 별도 안내를 드리고 있사오니 마이페이지에서 휴대전화번호와 메일주소를 다시 한번 확인해주시기 바랍니다.
(판형과 판수 등이 다양한 도서는 찾으시는 도서의 ISBN을 알려 주시면 보다 빠르고 정확한 안내가 가능합니다.)
해외거래처에서 품절인 경우, 2차 거래선을 통해 유럽과 미국 출판사로 직접 수입이 진행될 수 있습니다.
수입 진행 시점으로 부터 2~3주가 추가로 소요되며, 해외에서도 유통이 원활하지 않은 도서는 품절 안내가 지연될 수 있습니다.
해당 경우, 문자와 메일로 별도 안내를 드리고 있사오니 마이페이지에서 휴대전화번호와 메일주소를 다시 한번 확인해주시기 바랍니다.