
소득공제
수입
직수입양서
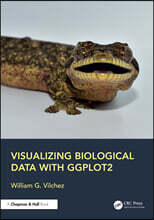
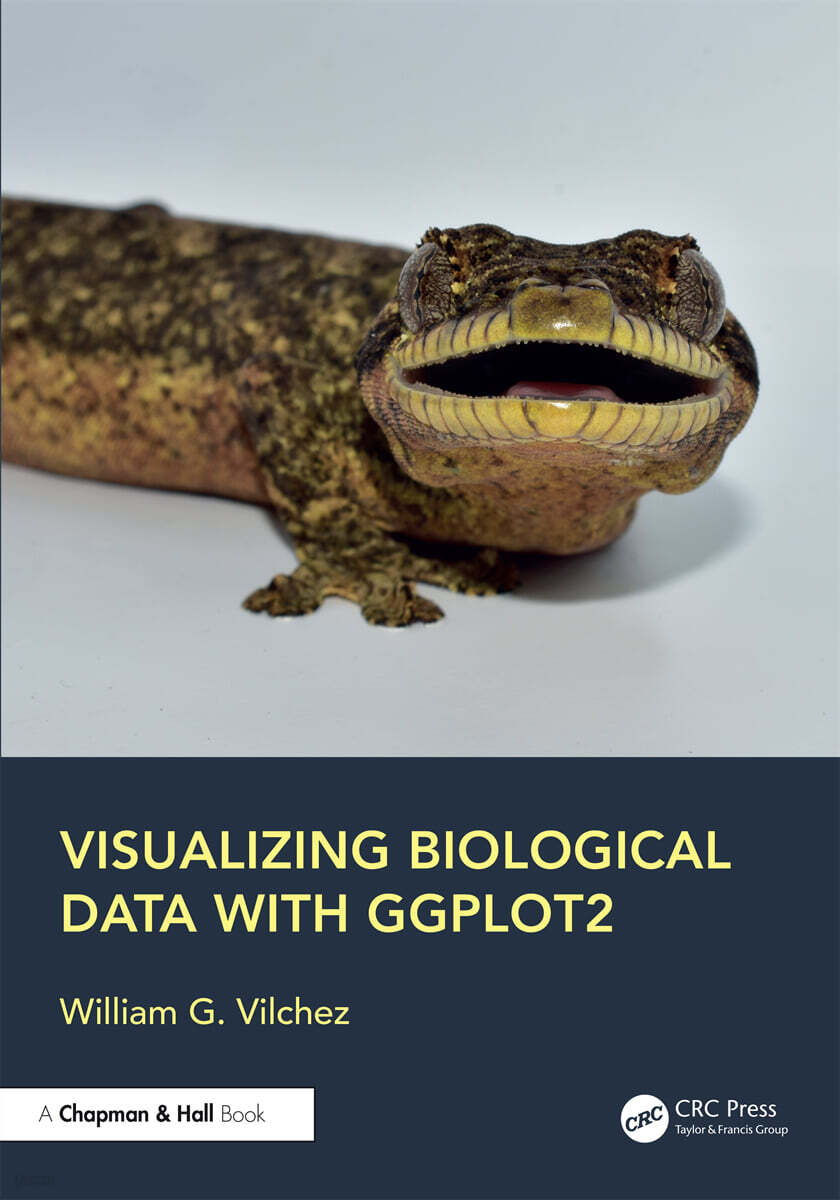
Visualizing Biological Data with ggplot2
Paperback, 1st Edition, Illustrations, Color
William G. Vilchez
Chapman and Hall/CRC
2026.08.30.
이미 소장하고 있다면 판매해 보세요.
- 국내배송만 가능
- 해외 거래처 사정에 의하여 품절/지연 가능
- 도서 정보 중 미표기 사항 안내?
- 문화비소득공제 가능
Chapman & Hall/CRC Computational Biology Series
-
 Computational Intelligence for Oncology and Neurological Disorders 이동Computational Intelligence for Oncology and Neurological Disorders10% 110,730원
-
RNA: Computational Methods for Structure, Kinetics, and Rational Design: Volume One 이동RNA: Computational Methods for Structure, Kinetics, and Rational Design: Volume One15% 104,580원
-
Big Data in Omics and Imaging, Two Volume Set 이동Big Data in Omics and Imaging, Two Volume Set10% 563,850원
-
RNA: Computational Methods for Structure, Kinetics, and Rational Design 이동RNA: Computational Methods for Structure, Kinetics, and Rational Design15% 157,830원
-
RNA: Computational Methods for Structure, Kinetics, and Rational Design 이동RNA: Computational Methods for Structure, Kinetics, and Rational Design15% 327,090원
-
RNA: Computational Methods for Structure, Kinetics, and Rational Design: Volume One 이동RNA: Computational Methods for Structure, Kinetics, and Rational Design: Volume One15% 197,760원
-
Systems Biology and Machine Learning Methods in Reproductive Health 이동Systems Biology and Machine Learning Methods in Reproductive Health15% 157,830원
-
Systems Biology and Machine Learning Methods in Reproductive Health 이동Systems Biology and Machine Learning Methods in Reproductive Health15% 277,650원
-
Data Integration, Manipulation and Visualization of Phylogenetic Trees 이동Data Integration, Manipulation and Visualization of Phylogenetic Trees10% 102,680원
-
Computational Intelligence for Oncology and Neurological Disorders 이동Computational Intelligence for Oncology and Neurological Disorders15% 237,710원
-
Introduction to Computational Systems Biology 이동Introduction to Computational Systems Biology10% 102,680원
-
Data Integration, Manipulation and Visualization of Phylogenetic Trees 이동Data Integration, Manipulation and Visualization of Phylogenetic Trees10% 209,400원
책소개
목차
|
Chapter 1: The Science and Art of Data Visualization Chapter 2: Introduction: Let's talk about R and RStudio Chapter 3: The tidyverse Chapter 4: Plots with a continuous X variable Chapter 5: Plots with two or more continuous variables Chapter 6: Plots with two variables X - Y: discrete X and continuous Y Chapter 7: Other plots and tables Chapter 8: Labels Chapter 9: Use of color palette Chapter 10: Graphics to avoid Chapter 11: Split-panel figures Chapter 12: Additional changes to the design of your plot Chapter 13: Interactive plots Chapter 14: Export your plots |
관련 분류
품목정보
- 발행일
- 2026년 08월 30일
- 쪽수, 무게, 크기
- 232쪽 | 460g | 180*250mm
- ISBN13
- 9781032894430
사락 별점0
혜택 및 유의사항밑줄0
혜택 및 유의사항상품정보안내
직수입외서의 경우, 해외거래처에서 제공하는 정보가 부족하여 제목, 표지, 가격, 유통상태 등의 정보가 미비하거나 변경되는 경우가 있습니다. 정확한 확인을 원하시는 경우, 일대일 상담으로 문의하여 주시면 답변 드리겠습니다.
(판형과 판수 등이 다양한 도서는 찾으시는 도서의 ISBN을 알려 주시면 보다 빠르고 정확한 안내가 가능합니다.)
해외거래처에서 품절인 경우, 2차 거래선을 통해 유럽과 미국 출판사로 직접 수입이 진행될 수 있습니다.
수입 진행 시점으로 부터 2~3주가 추가로 소요되며, 해외에서도 유통이 원활하지 않은 도서는 품절 안내가 지연될 수 있습니다.
해당 경우, 문자와 메일로 별도 안내를 드리고 있사오니 마이페이지에서 휴대전화번호와 메일주소를 다시 한번 확인해주시기 바랍니다.
(판형과 판수 등이 다양한 도서는 찾으시는 도서의 ISBN을 알려 주시면 보다 빠르고 정확한 안내가 가능합니다.)
해외거래처에서 품절인 경우, 2차 거래선을 통해 유럽과 미국 출판사로 직접 수입이 진행될 수 있습니다.
수입 진행 시점으로 부터 2~3주가 추가로 소요되며, 해외에서도 유통이 원활하지 않은 도서는 품절 안내가 지연될 수 있습니다.
해당 경우, 문자와 메일로 별도 안내를 드리고 있사오니 마이페이지에서 휴대전화번호와 메일주소를 다시 한번 확인해주시기 바랍니다.
110,730원
총 1개
110,730원