


이미지 검색을 사용해 보세요
검색창 이전화면 이전화면
최근 검색어
인기 검색어

가격
410,620
10 369,550
YES포인트?
18,480원 (5%) 마니아추가적립
5만원 이상 구매 시 2천원 추가 적립
결제혜택
최대 1,000원 적립
  •  국내배송만 가능
  •  예약도서와 함께 주문 시 도서 출간일에 함께 배송됩니다. (출판사의 사정으로 출간 지연 가능)
  •  해외 거래처 사정에 의하여 품절/지연 가능
  •  도서 정보 중 미표기 사항 안내?
  •  문화비소득공제 가능

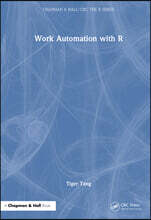
Chapman & Hall/CRC The R Series

책소개

목차

List of Figures List of Tables Preface Getting Started About the author 1 Creating an automation work project
1.1 Automation workflow
1.2 Automation opportunities
1.2.1 Types of work automation
1.2.2 Applying automation types in R
1.3 Project proposal
1.3.1 Goal
1.3.2 Impact
1.3.3 Resources
1.4 Requirements gathering
1.4.1 Key components
1.4.2 Tasks prioritization
1.5 Code development
1.5.1 Replacing manual processes
1.5.2 QA and testing
1.5.3 Staying on target
1.6 Maintenance
1.6.1 Hand-off documentation
1.6.2 Planning for future enhancements
1.7 Metrics and project updates
1.7.1 Impact update
1.7.2 Lessons learned
1.8 Conclusion 2 Working with real-world data
2.1 Data import and export workflow2.1.1 Inspecting raw data
2.1.2 Selecting the import method2.1.3 Verifying the import
2.2 Importing and exporting structured data2.2.1 Importing delimited text files2.2.2 Importing other structured file types2.3 Customizing data import behavior2.3.1 Partial imports2.3.2 Working with missing values (NA strings)2.3.3 Working with column types2.4 Advanced import techniques2.4.1 Importing large files efficiently2.4.2 Managing memory limits2.4.3 Comparing import methods2.4.4 Optimizing import speed2.5 Importing and merging multiple files2.5.1 Batch imports from folders2.5.2 Importing selected files2.5.3 Using parallel processing for importing2.5.4 Exporting data in batches2.6 Importing and exporting unstructured data2.6.1 JSON2.6.2 Image2.6.3 PDF2.6.4 Audio3 Working with databases3.1 Understanding databases3.1.1 Relational databases3.1.2 Non-relational databases3.2 Connecting to databases3.2.1 General workflow3.2.2 Database-specific connections3.2.3 Handling authentication3.3 Querying databases3.3.1 Inspecting table information3.3.2 Data definition operations3.3.3 Data extraction workflows3.4 Other considerations3.4.1 Common use cases3.4.2 Common issues with dates3.4.3 Performance optimization best practices3.4.4 Further integration4 Working with plots4.1 Bar charts4.1.1 Basic bar chart4.1.2 Stacked bar chart4.1.3 Grouped bar chart4.1.4 Interactive bar chart4.1.5 Racing bar chart4.2 Line charts4.2.1 Basic line chart4.2.2 Line chart with markers4.2.3 Interactive line chart4.2.4 Animated line chart4.3 Box plots4.3.1 Basic box plot4.3.2 Violin plot4.3.3 Interactive box plot4.4 Pie charts4.4.1 Basic pie chart4.4.2 Interactive pie chart4.5 Other chart types4.5.1 Heat map4.5.2 Dual axis chart4.6 Customization4.6.1 Labels and text elements4.6.2 Annotation4.6.3 Fonts4.6.4 Images4.7 Themes4.7.1 Themes in ggplot24.7.2 Using themes with ggthemes4.7.3 Customizing your own theme4.8 General considerations4.8.1 Automation in plotting4.8.2 General guidelines5 Working with maps5.1 Static maps5.1.1 Country-level maps5.1.2 Continent-level maps5.1.3 World maps5.2 Interactive maps5.2.1 Country-level maps5.2.2 Continent-level maps5.2.3 World maps5.3 Street map with leaflet5.3.1 Working with markers5.3.2 Working with pop-ups5.3.3 Using different map tiles6 Working with tables6.1 HTML tables with basic formats6.1.1 DT6.1.2 reactable6.1.3 gt6.2 HTML tables with search, filtering, and export6.2.1 DT6.2.2 reactable6.2.3 gt6.3 Conditional formatting and styling6.3.1 Styling columns and rows6.3.2 Styling based on values in other columns6.3.3 Styling part of a cell6.3.4 Styling with color scales6.3.5 Styling with emojis and images6.3.6 Styling with inline charts6.4 Interactivity with HTML tables6.4.1 Clickable hyperlinks6.4.2 Hover-over tooltips6.4.3 Interactivity with other widgets6.4.4 Tables in Shiny applications7 Working with reports7.1 HTML reports and dashboards7.1.1 Report structure template7.1.2 Standard report workflow7.1.3 Using parameters for dynamic reports7.1.4 Dashboard design with flexdashboard7.2 Excel reports7.2.1 Extracting from Excel spreadsheets7.2.2 Updating Excel spreadsheets7.2.3 Customization with Excel7.2.4 Excel report workflow7.3 Word reports7.3.1 Extracting from Word documents7.3.2 Updating Word documents7.3.3 Customization with Word7.3.4 Word report workflow7.4 PDF reports7.4.1 Extracting from PDF7.4.2 Modifying PDFs7.4.3 Customization with PDF7.4.4 PDF report workflow7.5 Working with presentations7.5.1 Updating PowerPoint slides with officer7.5.2 Interactive Slides with R Markdown and Quarto8 Working with emails8.1 Setting up email connections8.1.1 Outlook8.1.2 Gmail8.1.3 Other providers8.2 Send a generic email8.2.1 RDCOMClient for Outlook on Windows8.2.2 Blastula option8.2.3 Microsoft365R option8.2.4 SendmailR option8.3 Customizing your emails8.3.1 Formatting email body8.3.2 Embedding and attaching content8.3.3 Other customization8.4 Creating an email report8.4.1 Writing narrative summaries8.4.2 Automated email workflows8.4.3 Triggering emails from a Shiny app8.5 Reading and processing emails8.5.1 Reading emails from Outlook8.5.2 Reading emails from Gmail8.5.3 Automation examples with processing emails9 Working with messaging apps9.1 Platform setup and integration9.1.1 Slack application setup9.1.2 Teams application setup9.2 Message content and formatting9.2.1 Slack9.2.2 Teams9.3 Uploading content to messaging apps9.3.1 Uploading files (Slack and Teams)9.3.2 Uploading plots (Slack and Teams)9.3.3 Uploading HTML widgets (Slack and Teams)9.4 Automating message delivery9.4.1 Regular updates and reminders9.4.2 Job and metric notifications9.4.3 Report summary delivery9.5 Monitoring and automated interaction9.5.1 Monitoring incoming messages9.5.2 Auto responses9.6 Maintenance and evaluation9.6.1 Monitoring9.6.2 Measuring impact10 End to end with Shiny10.1 Creating interactive tables with Shiny10.1.1 A minimal example10.1.2 Extending table functionality10.2 Building dynamic plots with Shiny10.2.1 A minimal example10.2.2 Extending plot functionality10.3 Visualizing geographic data with Shiny10.3.1 A minimal example10.3.2 Extending map functionality10.4 Querying and updating databases with Shiny10.4.1 A minimal example10.4.2 Extending database functionality10.5 Automating data import and evaluation with Shiny10.5.1 A minimal example10.5.2 Extending evaluation workflows10.6 Generating reports with Shiny10.6.1 A minimal example10.6.2 Extending reporting workflows10.7 Additional Shiny use cases10.7.1 Interactive metric exploration10.7.2 Building a data labeling interface11 Combine everything and automate11.1 Scenarios for automation11.2 Preparing code for automation11.2.1 Using a project-oriented workflow11.2.2 Documenting your code11.2.3 Cleaning code11.2.4 Removing hidden dependencies11.2.5 Connecting code11.3 Testing automated workflows11.3.1 Unit tests11.3.2 User acceptance tests11.3.3 Anomaly tests11.4 Scheduling automated jobs11.4.1 Scheduling with cronR11.4.2 Scheduling with taskscheduleR11.4.3 Scheduling with Posit Connect11.4.4 Scheduling with other automation tools11.5 Monitoring automated jobs11.5.1 Operation notifications11.5.2 Operation logs11.6 End-to-end example11.6.1 Use case overview11.6.2 Step-by-step implementation12 Maintain the automation12.1 Documenting requirements12.1.1 Requirements template12.1.2 Key considerations12.2 Documenting instructions12.2.1 Instruction templates12.2.2 Key considerations12.3 Internal training12.3.1 R knowledge12.3.2 Institutional knowledge12.4 Tracking usage12.4.1 Usage notifications12.4.2 User metrics12.5 Tracking automation impact12.5.1 Hours saved12.5.2 Training and documentation benefits12.5.3 Other impacts13 Performance Optimization, Concurrency, and Error Handling13.1 Process efficiency13.1.1 Identifying long operations13.1.2 Parallel processing13.1.3 Supporting concurrent users in Shiny13.2 Handling errors13.2.1 Creating custom errors13.2.2 Capturing errors with tryCatch()AppendixA Table styling utilitiesA.1 color_scale_DT()A.2 color_scale_rt()A.3 styleColorBarMiddle()A.4 bar_reactable()B Report utilitiesB.1 Adding branding to R Markdown reportsB.2 Embedding report summaries in emailsC Visualization utilitiesC.1 Creating animated geographic maps with Plotly

품목정보

발행일
2026년 09월 23일
쪽수, 무게, 크기
368쪽 | 180*250mm
ISBN13
9781032439457

리뷰/한줄평0

리뷰

첫번째 리뷰어가 되어주세요.

한줄평

첫번째 한줄평을 남겨주세요.

상품정보안내

직수입외서의 경우, 해외거래처에서 제공하는 정보가 부족하여 제목, 표지, 가격, 유통상태 등의 정보가 미비하거나 변경되는 경우가 있습니다. 정확한 확인을 원하시는 경우, 일대일 상담으로 문의하여 주시면 답변 드리겠습니다.
(판형과 판수 등이 다양한 도서는 찾으시는 도서의 ISBN을 알려 주시면 보다 빠르고 정확한 안내가 가능합니다.)

해외거래처에서 품절인 경우, 2차 거래선을 통해 유럽과 미국 출판사로 직접 수입이 진행될 수 있습니다.
수입 진행 시점으로 부터 2~3주가 추가로 소요되며, 해외에서도 유통이 원활하지 않은 도서는 품절 안내가 지연될 수 있습니다.
해당 경우, 문자와 메일로 별도 안내를 드리고 있사오니 마이페이지에서 휴대전화번호와 메일주소를 다시 한번 확인해주시기 바랍니다.

369,550
1 369,550